

CURAM CARE HOME
CASE STUDY
.


Curam Care Home, a healthcare facility located in Dublin, Ireland, planned proactively and decided to implement Intelli-Hood® in their commercial kitchen's new facility. Intelli-Hood® is a dual sensing DCKV solution that maximizes a commercial kitchen's operation and performance. As cooking loads are reduced, so is your energy demand through self-learning metrics and measurements of temperature and effluent; steam and vapour by varying the speed of ventilation system in-between demand. This study shows the savings results Curam Care achieved with Intelli-Hood®.
Overview
Curam Care Home would have spent an average of €13,188 in utility costs per year without Intelli-Hood®. Figure A below depicts the customer's predicted annual energy costs as compared to their actual energy costs. After installing Intelli-Hood®, Curam Care realised a 60%+ reduction in energy costs their first year. This facility is saw an annual reduction of €7,929 on their energy bill by utilising Intelli-Hood® in their commercial kitchen.
Benefits
Annual Kitchen Canopy Utility Costs (GBP)
Figure A


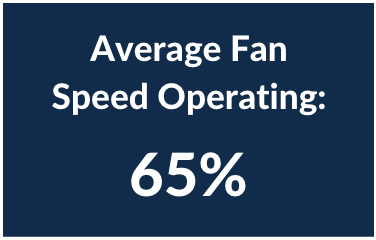
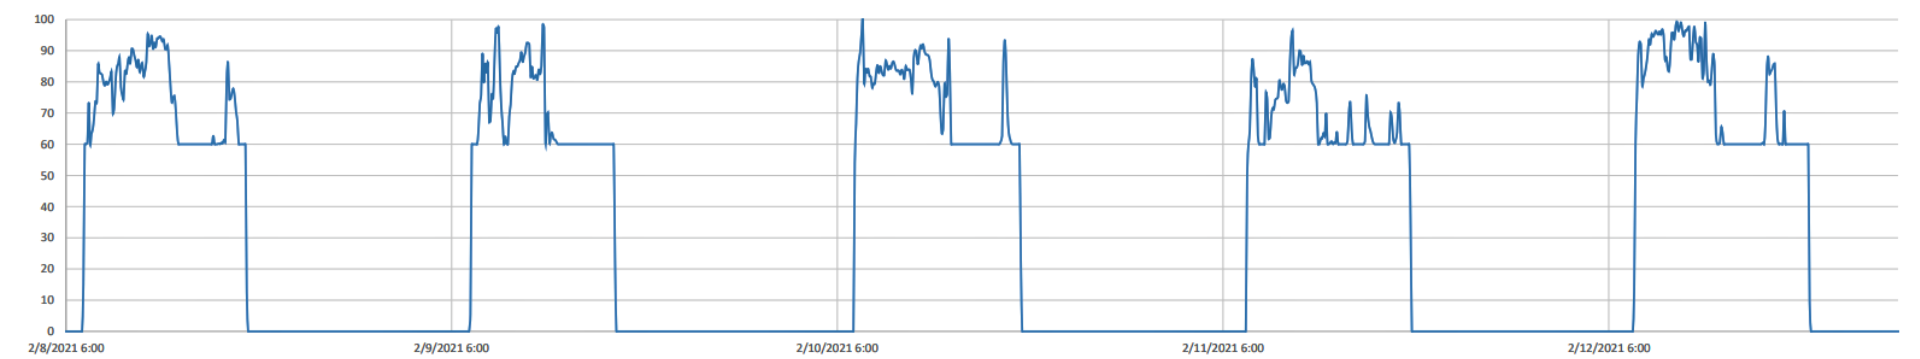
The chart below, Figure B, shows the average fan speed for the exhaust fans over the course of a week. The dips in the chart represent times when the fans are not running, and the spikes represent when the fans are operating. The spikes in fan speed change slightly which means the fans are running more efficiently. The average fan speed for these exhausts was 65%.
Exhaust Fan Average Run Speed
Figure B